Bitcoin moves in cycles.
Years of despair, then euphoria, then despair again. Nobody knows whether that continues, but it is measurable while it lasts.
Years of despair, then euphoria, then despair again. Nobody knows whether that continues, but it is measurable while it lasts.
A hundred YouTubers, a thousand charts, zero clear answers. You just want to know: where inside the cycle are we, right now?
We developed a complex cycle risk metric. Published daily. Timestamped forever. Verifiable by anyone.
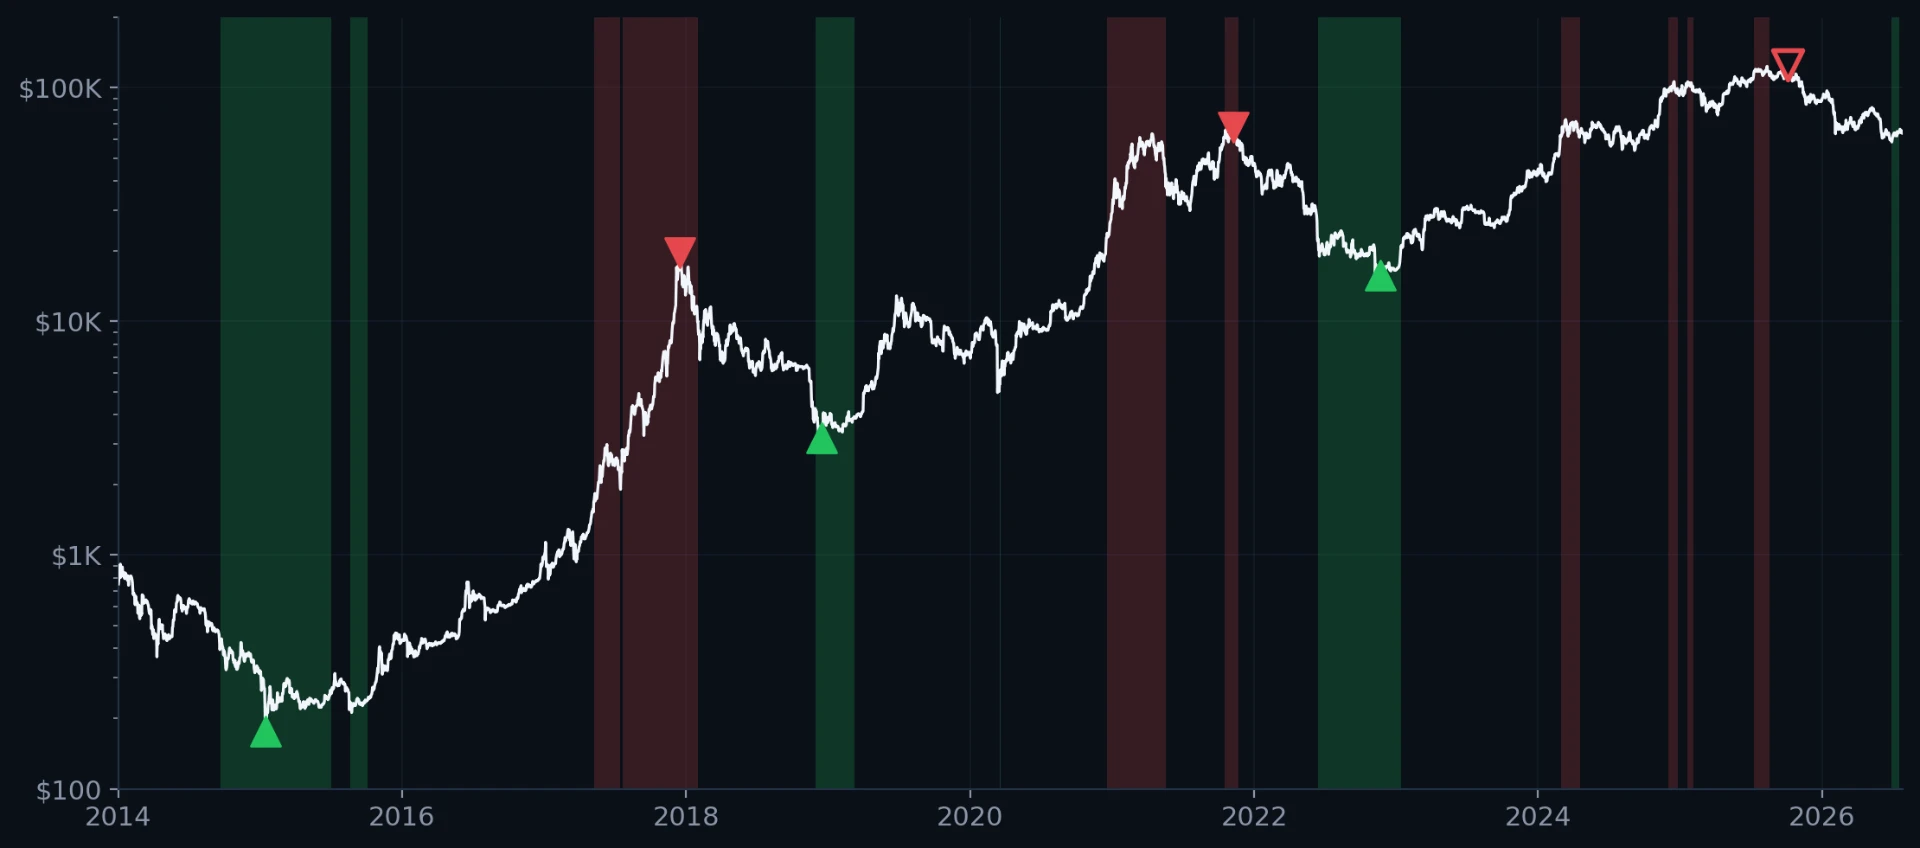
Green = heavy accumulation zone; ▲ actual bottoms
Red = distribution zones; ▼ actual tops, ▽ 2025 top
cycle bottoms happened inside the green zone
average exit price versus each cycle top: 2017, 2021, 2025
Seven market indicators, three independent views of the cycle — combined into one score. We tested every famous indicator alone. All failed at some level. The combination didn't.
How stretched is the price versus its own long-term history?
Are Bitcoin holders sitting on huge profits (danger) or losses (opportunity)?
Is the market overheating or cooling down?
Mayer Multiple · 200-week extension · log-regression deviation · MVRV-Z · NUPL · Puell Multiple · monthly RSI
The formula is public. The rules never change quietly.See full methodology →
The index says where the market is. It never says what to do, but we developed two powerful strategies.
Buy-only.
Deposits scale with the zone: 3× the base amount in Heavy Accumulation, less in other accumulation zones, nothing above Neutral. It never sells. There is nothing to decide at the top, and no gains are realised along the way. It holds through the whole drawdown.
Buys and trims.
The same deposits, plus small weekly sell tranches in the distribution zones. The cash raised waits through Neutral and goes back into Bitcoin during the deep zones — so the cycle funds the next one. More moving parts, and selling realises gains.
Neither strategy predicts a top, and neither ever fully exits. They trim seasons; they do not call peaks.
Every possible start day since 2014, judged at every quarter since — 37,072 scenarios against the most honest benchmark there is: buying on a fixed schedule, no matter what (Plain DCA).
start days tested — one for every day since 2014
of them: the Full Cycle strategy finished ahead of plain DCA
still ahead when judged at every quarter along the way, not just at the end
the median return on investment deposited, versus plain DCA
Historical backtests of the frozen v1.0.1 rules. The past never guarantees the future. Full methodology, including the scenarios where it loses, is in the research note.
Run your own dates in our DCA simulator → Every start date, every schedule, every amount
You already DCA into Bitcoin every week or month. You just want to know if the market is in fear or euphoria — without becoming a chart addict.
You're done chasing 100× coins that went to zero. You want one asset, one number, and your evenings back.
Built by someone who wanted the number to exist and couldn't find one he trusted.
It's a percentile rank against Bitcoin's own history. A reading of 0.15 means only about 15% of past days looked cheaper on these measurements than today. It isn't a price target or a forecast.
Gresham's Law says bad money drives out good — people spend the weaker currency and hold the stronger one. The index is built for the holding half of that instinct.
No, and we don't claim it does. It describes conditions in zones, not moments. The exact 2025 cycle top printed 0.73 — outside the distribution zone — and that reading stays in the public record.
The index always describes the previous day's settled close — a day's closing data only exists once the day is over, and we'd rather publish a confirmed number late than an unconfirmed one early. The publication time itself varies, usually late morning UTC, occasionally later, because the job runs on free scheduling infrastructure that isn't guaranteed to fire on time. Every reading carries the date of the data it describes, so you always know exactly what you're looking at, and the site flags it if the data falls more than 48 hours behind. We're working on making the publication time more consistent.
In practice the delay changes little. The index moves by about 0.003 on a typical day, and even on the twenty largest single-day price moves since 2014 — a median of 17% — it shifted by less than 0.01. It is built to describe seasons, not sessions. If it moved enough for a day to matter, it would be the wrong kind of instrument.
Because it isn't built to. The published reading is a seven-day average, so any single day carries about a seventh of the weight, and the heaviest input — monthly RSI — is measured on monthly closes and barely registers a day at all.
The effect is stronger than most people expect. From a reading of 0.32, a one-day price move of any size, however large, tops out near 0.39. Reaching the distribution zone doesn't require a dramatic day; it requires elevated conditions that persist for weeks.
That's deliberate. A number that jumped with the price would just be the price again, and you'd have to watch it. It's also why the exact top day of a cycle rarely produces the highest reading.
No. It's an informational and educational tool. The index describes market conditions; the strategies are published rulesets, not recommendations. All of information presented are historical sumulation; past results do not indicate future performance. Crypto-assets are highly volatile and this is not reccomendation on where and how to allocate your investment funds.
Then this does worse than simply holding — in a tested scenario where Bitcoin rises fiftyfold with no serious drawdown, the strategy trails a plain schedule by 54%. The reason it isn't worse: the trims are small and weekly, 1.5% or 4% of the stack, so the position is never sold off on the way up and the core keeps riding. That's the honest trade — protection against cycle mistiming, paid for with some upside if the cycles stop.
It is An independent project from Slovakia. It was built with AI assistance, directed and edited by a human — we'd rather say that plainly than let anyone discover it later.